
How to Spot a Trending TikTok Shop Product Before It Peaks
You spot a trending TikTok Shop product before it peaks by reading the trend percentage alongside creator count, not the trend alone. A product with a huge trend percentage and a low creator count is likely early. The same trend percentage on a product with thousands of creators already promoting it is likely late — you're seeing the middle or end of the wave, not the start.
- A high trend percentage does not tell you where a product is in its lifecycle by itself — you have to check creator count alongside it.
- A low creator count relative to revenue (what this article calls whitespace) is one of the clearest signals that a trend still has room to run.
- Daily revenue data can reveal a real relaunch or restock event that a single weekly trend percentage hides.
- The single highest-revenue product in a dataset is not automatically the best opportunity — check commission rate and creator saturation before assuming it's a winner.
- A rating well below the rest of a category (for example, under 3.5 stars when most competitors sit above 4.0) is a warning sign a hot trend can't fix.
Why This Matters
Every week, a new batch of TikTok Shop products shows a big trend percentage. Some of them are genuinely early opportunities. Others are already crowded, already declining, or already carrying a quality problem the trend percentage doesn't show. This article is for beginner dropshippers, TikTok Shop sellers, and product researchers who want a repeatable way to tell the difference — using the same kind of weekly product data platforms like Kalodata provide.
You'll learn what a trend percentage actually measures, why creator count changes what that percentage means, how to read daily revenue data for signs of a real relaunch or a fading peak, and a step-by-step process you can run on any week's dataset.
What a Trend Percentage Actually Is
A trend percentage compares a product's revenue over a recent period to an earlier period. A product showing ▲636.8%, for example, made roughly 7.4 times more revenue in the recent window than the prior one. That's a real, useful number — but it says nothing about how many other sellers and creators are already competing for that same demand.
How It Works
Trend percentage is calculated from a product's own revenue history, so it's always relative to that specific product's past, not to the category as a whole. A small product going from $10,000 to $70,000 in revenue can show a similar percentage jump to a large product going from $500,000 to $3.5M — but those are very different opportunities in practice.
The Whitespace Signal: Creator Count vs. Revenue
Whitespace, in this framework, means low creator competition relative to revenue. Compare a product's creator count to its revenue level, and compare that ratio to similar products in the same category. A lower creator count for a similar revenue level generally means it's easier for a new creator's content to be noticed and to convert.
| Product | Trend | Creators | Revenue | Commission | Rating | What It Shows |
|---|---|---|---|---|---|---|
| Ninja SLUSHi Professional Frozen Drink Maker | ▲349.7% | 1,333 | $2.04M | 5% | 4.8 | Loud trend, meaningful revenue, thin but real whitespace |
| Shark WandVac Cordless Handheld Vacuum (WV201/WV205) | ▲636.8% | 517 | $1.01M | 5% | 4.3 | Steepest trend, widest whitespace of the two |
| SEESE Cordless Pressure Washer | ▲69.4% | 3,173 | $2.23M | 6% | 4.2 | Highest revenue, but most saturated + lowest commission |
Dataset: Operator Signal Issue 17 Kalodata export, September 6, 2026.
Reading Daily Revenue, Not Just the Weekly Number
A single trend percentage can hide a lot. A product can show a modest weekly trend while its daily revenue actually spiked hard mid-week and then collapsed to zero — a sign of a stockout or a delisted product, not steady growth. Pulling the daily revenue breakdown, when it's available, tells you whether a trend is a smooth climb, a single-day spike, or a genuine relaunch that settled into a new, sustained pace.
Dataset-Based Example
From Operator Signal Issue 17's Kalodata dataset:

Why it wins: $2.
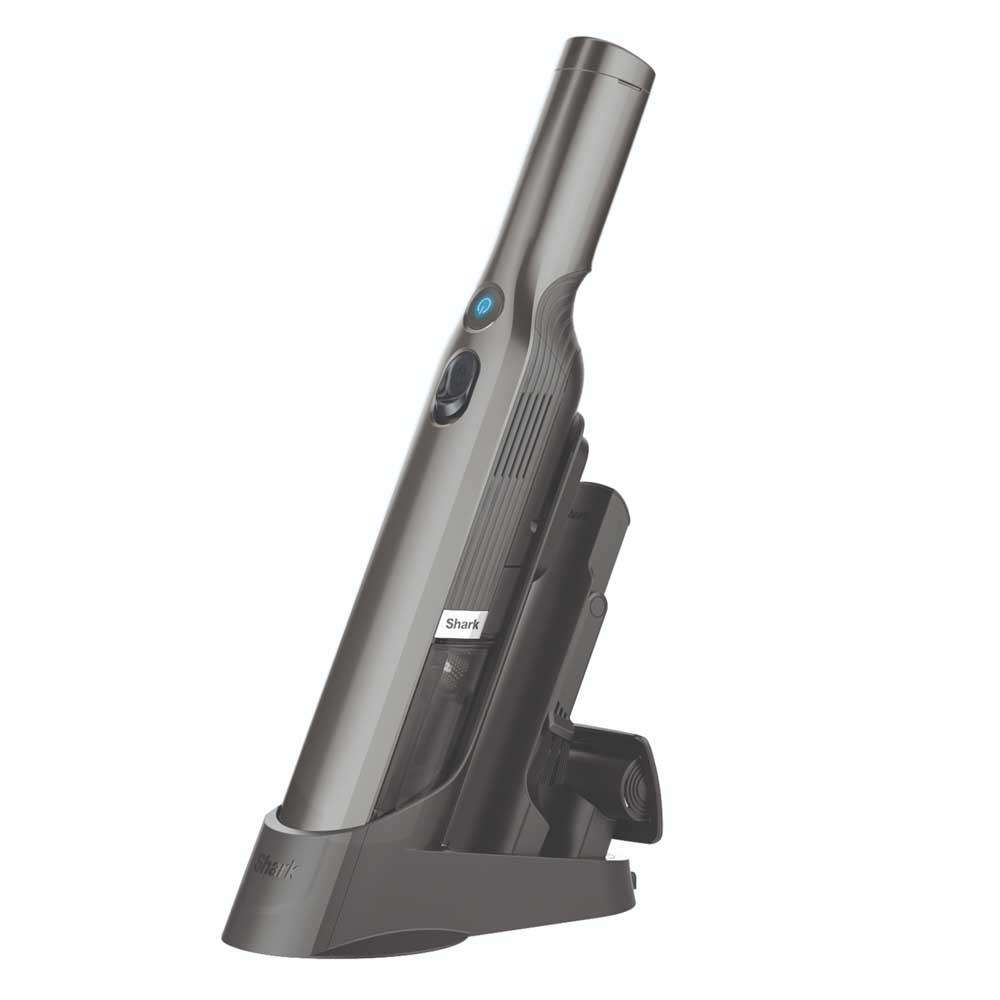
Why it wins: ▲636.
Full breakdown of both products — along with the complete Top 5, Top 10 ranking, and this issue's Launch Pick — is reserved for Operator Signal subscribers.
Benefits of Reading Trend Data This Way
- You catch products while the creator field is still thin, instead of after it's crowded.
- You avoid launching into a product that's actually already declining behind a still-positive weekly number.
- You build a repeatable, data-backed process instead of chasing whatever looks exciting in your feed.
Disadvantages and Risks
- Whitespace can close fast — once a product's comeback or trend becomes visible to more operators, creator count can climb within days.
- A low creator count can also mean a product is niche or hard to sell, not just early — check rating and CCR together with creator count, not creator count alone.
- Daily revenue data isn't always available in every dataset export, which limits how far back you can check a trend's real shape.
Who Should Use This Framework
Beginner dropshippers and TikTok Shop sellers evaluating which product to launch next; product researchers building a repeatable weekly process; content creators deciding which brand deals to prioritize.
Who Should Avoid Chasing Trend Percentage Alone
Anyone without the time or tooling to check creator count and daily revenue alongside the headline trend number — a trend percentage by itself is not enough information to launch on.
Common Myths
Common Mistakes
- Chasing the biggest trend percentage without checking creator count — a huge percentage on a tiny revenue base can mean almost nothing at scale.
- Assuming the single highest-revenue product in a dataset is automatically the best launch — it may already be the most crowded and lowest-margin.
- Ignoring product rating when a trend looks exciting — a low rating (well under 4.0) usually means return and refund problems are coming.
- Reading only the weekly trend percentage and skipping the daily revenue data, which can hide a stockout, a dead listing, or a single-day spike that already passed.
- Launching at full budget on day one instead of testing with a small creator group first and confirming the trend holds day over day.
Expert Tips
- Treat any product with more creators than its revenue level would suggest as a warning sign, not a proof of popularity — oversaturation and popularity look similar on the surface.
- When two products show a similar trend percentage, the one with fewer creators is very likely the better window to move on first.
- Recheck your top candidates weekly — whitespace closes fast once other operators notice the same signal you did.
- A product that goes from a strong single day to multiple days of near-zero revenue is telling you something happened (stockout, delisting, algorithm shift) — don't treat that data the same as a smooth decline.
Step-by-Step Process
- Pull the full weekly product dataset, not just a top-10 leaderboard — the interesting whitespace signals often sit outside the top 5 by revenue.
- Sort by revenue first to see the overall field, then re-sort by trend percentage to find what's actually accelerating right now.
- For every candidate with an exciting trend percentage, check its creator count next to its revenue level — that ratio is your whitespace signal.
- Pull the daily revenue array (not just the weekly summary percentage) for your top 5–10 candidates to check whether the trend is a steady climb, a single-day spike, or a comeback after a flat period.
- Cross-check rating and commission rate for every candidate — a great trend with a weak rating or thin commission is a much smaller opportunity than the headline number suggests.
- Rank your final candidates using revenue growth, creator conversion, saturation, commission, rating, price viability, content potential, and fulfillment risk together — not any single metric alone.
- Pick one product to test first, based on the strongest combination of whitespace and durability signals, not the single biggest headline number.
- Trend percentage checked alongside creator count, not alone
- Daily revenue reviewed for spikes, drops, or a flatline
- Rating compared against similar products in the same category
- Commission rate compared against price, not viewed in isolation
- Creator conversion ratio checked for the product, not assumed
Current Opportunity Signals and Future Outlook
Not available in the supplied dataset beyond this issue's snapshot: broader seasonal or category-wide trend direction requires tracking multiple weeks of data over time. What this week's data does show is that whitespace and headline revenue don't always point to the same product — a pattern worth watching for in future issues as well.
Final Decision Guide
If a product shows a strong trend percentage and a creator count that's low relative to its revenue and category, it's likely still early — worth a small, controlled test. If the trend percentage is strong but creator count is already high relative to revenue, treat it as a signal the window may already be closing. If the rating is well below category norms, deprioritize it regardless of the trend.
Conclusion
A trend percentage is a starting point, not a verdict. Reading it alongside creator count, daily revenue shape, rating, and commission rate is what separates an operator who catches a product early from one who launches into a crowded, cooling, or already-broken listing. Operator Signal runs this exact framework against a fresh Kalodata export every week — subscribe free for the headline call, or go paid for the full Top 5, rankings, and Launch Pick.
Get next week's Top 5, eliminations, and Launch Pick before the creator count catches up.
Subscribe to Operator Signal →Frequently Asked Questions
It usually means a product's revenue grew significantly over a recent period, expressed as a trend percentage. On its own, that percentage doesn't say whether the product is just starting to take off or already near its peak — you need creator count and daily revenue data to tell the difference.
Creator saturation is how many creators are already promoting a product relative to its revenue. A product with 500 creators and $1M in revenue has far less competition per creator than one with 5,000 creators and $2M in revenue. High saturation makes it harder for a new creator's content to stand out and earn sales.
No. Revenue level is one signal among many. A product can have the highest revenue in a dataset and still carry a low commission rate and heavy creator competition, which makes it a weaker opportunity for someone arriving today than a smaller, less saturated product.
Look at the daily revenue trend, not just the weekly percentage. A product with several consecutive days of falling daily revenue, or a sudden drop to near-zero after a spike, is showing signs of a peak already passing or a stock/listing problem.
This dataset's creator conversion ratio (CCR) measures roughly what share of creators featuring a product see it convert. Ratios above roughly 40–50% are strong; ratios below 20% suggest the product is harder to sell even when creators do post about it.
Generally no, if the rating is well below others in its category. A rating under roughly 3.5 stars, especially alongside a fast-rising trend, often points to a quality, sizing, or durability problem that shows up as returns and refunds once you start spending on ads.
A lot, for anyone relying on creator affiliate sales rather than owning the product outright. A 5% commission on a $130 item and a 20% commission on a $38 item can pay a creator a similar amount per sale — always compare commission rate alongside price, not in isolation.
Compare its creator count to its revenue level and to similar products in the same category. If its creator count is meaningfully lower than similar-revenue products, the opportunity is likely still open. If it's higher, the window may already be closing.


