How to Choose a Product
To choose a TikTok Shop product to sell, score every candidate on eight signals in this order: revenue trend direction, creator conversion ratio, creator saturation, commission or margin per sale, product rating, price and impulse-buy viability, content/demonstration potential, and fulfillment risk.

How to Choose a TikTok Shop Product to Sell (Step-by-Step Framework)
To choose a TikTok Shop product to sell, score every candidate on eight signals in this order: revenue trend direction (not just revenue level), creator conversion ratio, creator saturation, commission or margin per sale, product rating, price and impulse-buy viability, content/demonstration potential, and fulfillment risk. A product with a huge revenue total but a falling trend and thousands of competing creators is usually a worse choice than a smaller product with a rising trend and very few creators attached. The single most common beginner mistake is sorting a product list by revenue alone — revenue tells you a product has sold before, not that it's still selling now.
Key Takeaways
- Revenue rank and "still winning" are not the same thing — always check trend direction before revenue level.
- Creator saturation (how many people are already promoting a product relative to its revenue) can matter more than the trend percentage itself.
- Commission rate alone is misleading — calculate the actual dollar payout per sale (price × commission) before comparing two products.
- A product can pass every other test and still fail on fulfillment risk or content potential — score all eight signals, not just the ones that look good.
- The strongest opportunities are often not the #1-by-revenue product, but a lower-revenue product with a much wider gap between demand and competition.
What "Choosing a Product" Actually Means on TikTok Shop
Choosing a product to sell on TikTok Shop means selecting a specific SKU to list, promote, and drive short-form video content toward — out of thousands of available options, most of which are not worth your time. This guide is for beginner dropshippers, TikTok Shop sellers, and product researchers who want a repeatable, data-driven way to make that choice instead of picking whatever looks trendy on their own feed.
By the end of this guide, you'll be able to score any candidate product against an 8-signal framework, read a real dataset example the way an operator does, and avoid the single most common mistake in product selection: trusting revenue size over revenue direction.
How Product Selection Actually Works
Every product on TikTok Shop generates a data trail: total revenue, a day-by-day revenue trend, how many creators have posted about it, what share of those creators actually generated a sale (the creator conversion ratio, or CCR), the commission rate offered, and a star rating from buyers. Choosing a product well means reading that data trail as a whole, not cherry-picking the one or two numbers that happen to look impressive.
The mechanics are straightforward once you have the data: pull candidate products, score each one against the framework below, eliminate anything that fails on trend direction or rating regardless of revenue size, and shortlist the remainder for supplier vetting and a small content test before committing real ad spend.
Why This Matters Right Now
TikTok Shop's discovery-plus-checkout model means a product can go from unknown to heavily saturated with competing sellers in a matter of weeks, not months. That speed cuts both ways: it creates genuine, fast-moving whitespace opportunities, but it also means yesterday's winner can already be crowded by the time a new seller notices it trending. A repeatable selection framework is what separates operators who catch a product early from sellers who arrive after the creator count has already climbed past the point of easy entry.
Benefits of a Structured Selection Process
- Removes guesswork. Scoring candidates against fixed signals is repeatable, unlike picking based on what looks trendy today.
- Surfaces whitespace early. Comparing revenue against creator count can reveal products with real demand and almost no competition yet.
- Filters out expensive mistakes before launch. A falling trend or a sub-4.0 rating is cheaper to catch on paper than after spending on ads.
- Works across categories. The same eight signals apply whether you're evaluating a $10 hair spray or a $700 robot vacuum.
Disadvantages and Risks
- Data can lag reality. A weekly data pull is a snapshot — creator counts and trends can shift meaningfully within days.
- No framework guarantees a result. Scoring well on paper reduces risk; it does not guarantee a sale.
- Some signals require judgment calls. Content potential and fulfillment risk are read from the product itself, not a single clean number.
- Chasing the highest trend percentage alone can mislead. A huge percentage off a near-zero base is a different opportunity than steady growth on an already-large base.
Costs
Not available in the supplied dataset for platform-specific fee structures — check TikTok Shop's current seller terms directly, as fees and requirements change. As a general starting range, a small first product test (creator seeding plus a modest ad budget) typically runs $50–$300, scaling with how aggressively you test afterward.
Who Should Use This Framework
This framework suits beginner dropshippers and TikTok Shop sellers who want a repeatable weekly research habit, product researchers evaluating multiple categories at once, and content creators deciding which product to build a video series around. It's built for anyone who would rather spend an hour scoring candidates than a week finding out the hard way that a "trending" product was already saturated.
Who Should Avoid It
If you're looking for a single guaranteed pick or expect a framework to replace supplier vetting and content testing entirely, this isn't that. The framework narrows a large field of candidates to a short, defensible list — it doesn't remove the need to test small before scaling spend.
Alternatives to Data-Driven Selection
| Approach | Speed | Reliability | Best For |
|---|---|---|---|
| Data-driven scoring (this framework) | Medium | High | Repeatable weekly product research |
| Trend-chasing your own feed | Fast | Low | Casual testing, not a real business plan |
| Copying a competitor's exact listing | Fast | Low-Medium | Learning listing structure only, not product selection |
| Niche-first, then product research | Slow | Medium-High | Sellers building a long-term brand in one category |
Common Myths
- "The highest-revenue product is always the safest pick." High revenue confirms a product has sold before — it says nothing about whether demand is rising or falling right now.
- "A huge trend percentage always means a huge opportunity." A trend calculated off a near-zero base can look extreme while representing a smaller real-dollar shift than a steadier grower.
- "Low commission percentage always means a bad product." A low percentage on a high-priced item can still pay more per sale than a high percentage on a cheap one — calculate the dollar amount.
- "A high star rating cancels out a declining trend." A rating reflects buyers who already purchased — it says nothing about whether the listing is still generating new sales.
Every week, The Operator Signal runs this exact framework against a fresh Kalodata pull and publishes a free preview with one featured winner and the full eliminations list — no signup required to read it.
The 8-Signal Product Research Framework
Score every candidate product against these eight signals, roughly in this order of priority. A product doesn't need to be perfect on all eight — but a failure on trend direction or rating should eliminate a candidate regardless of how strong the rest of the profile looks.
- Revenue trend direction. Is recent revenue growing or shrinking? This matters more than the total revenue figure.
- Revenue level. Once trend direction is positive, a larger revenue base is a stronger, more proven signal than a tiny one.
- Creator conversion ratio (CCR). What share of creators who post the product actually generate a sale? Higher means the content genuinely persuades.
- Creator saturation. Compare creator count against revenue level — a small creator count relative to revenue signals real whitespace; a huge creator count relative to revenue signals a crowded, thinning opportunity.
- Commission or margin per sale. Multiply price by commission rate to get the real dollar payout — don't compare percentages alone.
- Product rating. A rating below roughly 4.0 usually signals a quality or fit issue that surfaces later as refunds and support load.
- Price and impulse-buy viability. Lower-priced items tend to convert with less consideration; higher-priced items need stronger trust-building content to justify the ask.
- Content potential and fulfillment risk. Can it be demonstrated solving a problem in under 30 seconds, ideally without sound? Is it large, fragile, or battery-powered enough to carry real shipping and return risk?
Dataset-Based Example: Reading Real Product Signals
The examples below are drawn from Operator Signal's Issue 16 Kalodata pull (Aug 30, 2026) and show the difference between a product with validated whitespace and one that only looks impressive on a spec sheet.
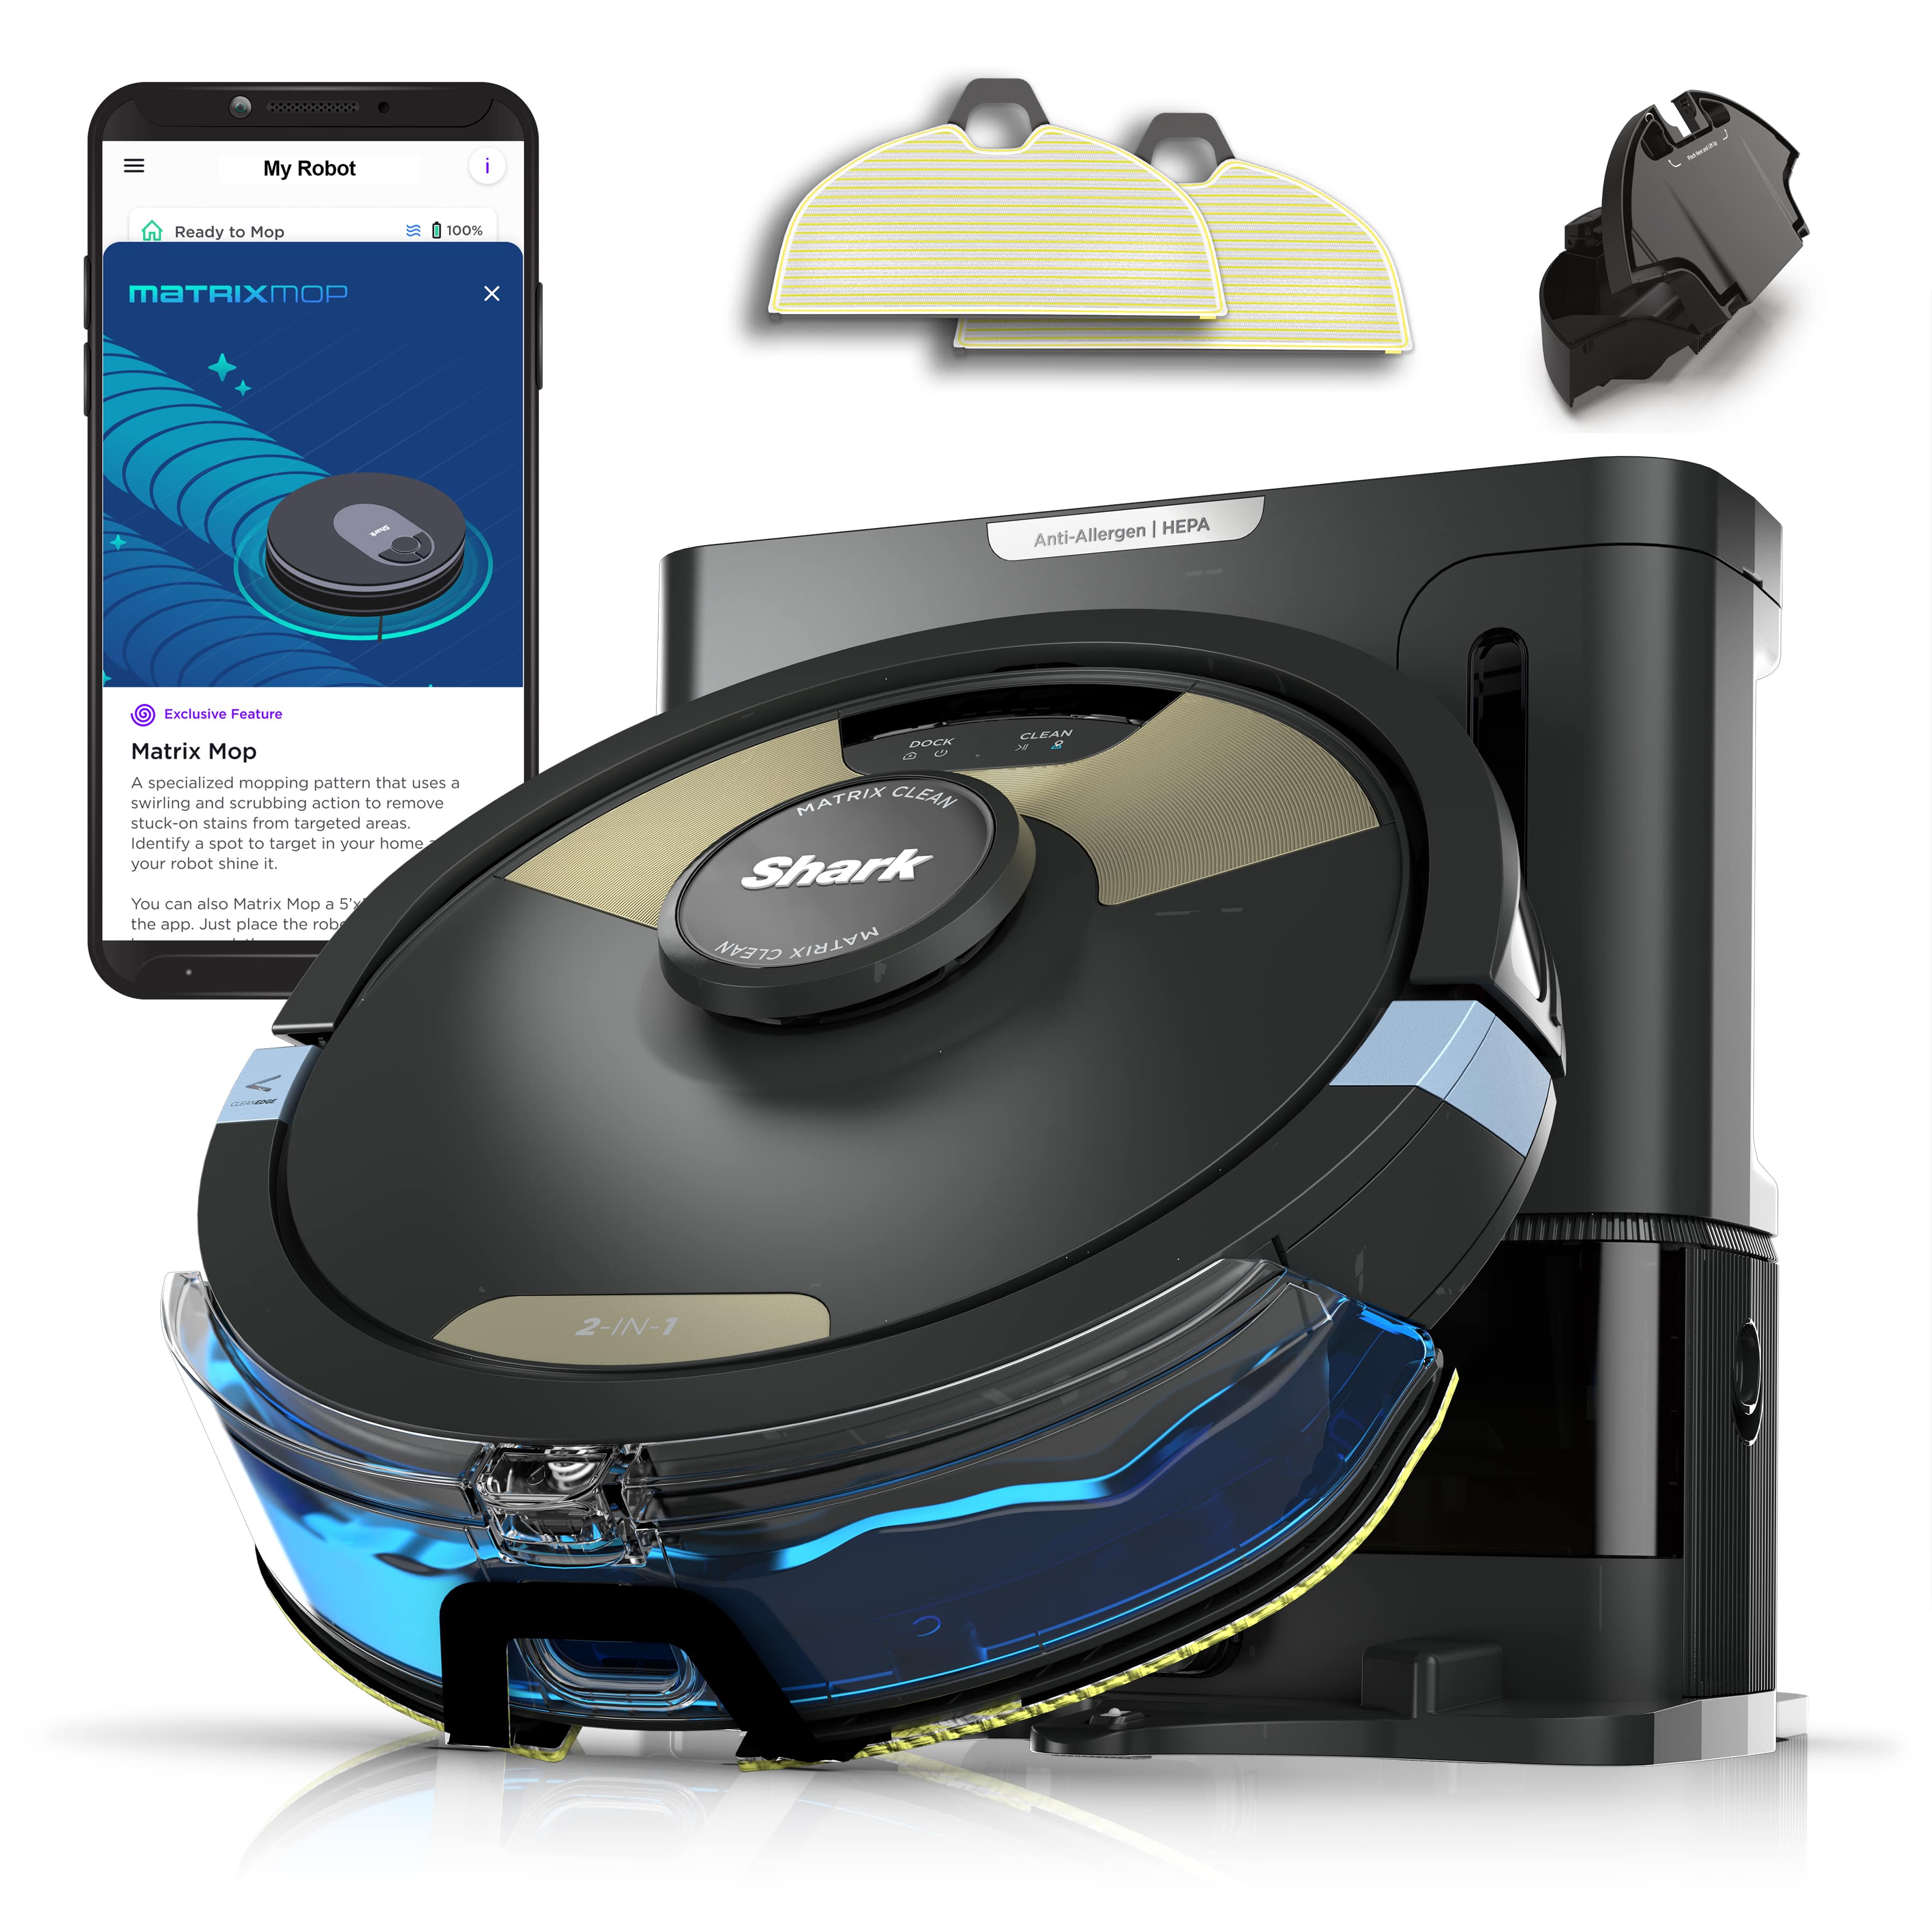
Validated whitespace: Shark Matrix Plus 2-In-1 Robot Self-Empty XL
$1.85M in revenue, trending ▲63.3%, against only 292 creators — roughly $6,336 in revenue per active creator, several times higher than every other strong performer in this week's pull. That gap between demand and competition, not the trend percentage alone, is what makes this issue's Launch Pick. Launched only about three months before this pull, the product reached that level of revenue with almost no creator competition yet forming.

Misleading on paper: the buffer™ brush — fluffy, dome foundation brush
A 4.9 star rating and a strong 61.4% creator conversion ratio make this product look like an easy pick on a spec sheet. But revenue has been cut nearly in half this pull (▼54.2%), and it was launched back in December 2023 — the oldest launch date in the entire dataset. Excellent per-unit metrics do not offset a declining trend; this reads as a maturing product cooling off, not a fresh opportunity.
Full analysis, the complete Top 5 and Eliminations lists, and the Launch Pick breakdown are available in the paid edition of Issue 16.
Signal vs. Hype: A Comparison
| Signal | What It Actually Confirms | Common Misread |
|---|---|---|
| High lifetime revenue | The product has sold before, at some point | Assuming it is still selling now — always check the trend, not just the total |
| Extreme trend percentage | Recent revenue is accelerating fast | Ignoring the base it's growing from — a spike off near-zero behaves differently than growth on an already-large base |
| Low creator count | Little competition has formed yet | Assuming low creator count alone means opportunity — check that revenue is real and trend is positive too |
| High star rating | Buyers who received the product were satisfied | Assuming a good rating offsets a declining trend — a great rating means little if the listing has stopped selling |
| High commission percentage | A generous cut of each sale | Ignoring price — a high percentage on a cheap item can pay less per sale than a lower percentage on an expensive one |
Step-by-Step: How to Choose a Product
- Pull recent sales data for candidate products rather than relying on what's trending in your own feed.
- Score each candidate against all 8 signals above, starting with trend direction.
- Eliminate anything with a falling trend, a rating under 4.0, or a near-zero creator conversion ratio, regardless of how large the revenue number looks.
- Rank the survivors by revenue-per-creator or revenue-per-competitor to spot whitespace, not just by raw revenue.
- Calculate the real dollar payout per sale (price × commission) for your top 3–5 candidates.
- Check content potential — can the product be demonstrated solving a problem in under 30 seconds, ideally without sound?
- Vet a supplier for your top pick — confirm shipping times, return policy, and product quality before listing.
- Test small with organic content and a small creator seeding batch before committing paid spend.
- Re-run this process weekly — creator counts and trends can shift meaningfully within days.
Common Mistakes When Choosing a Product
- Sorting candidates by revenue alone. The highest-revenue product in a dataset is frequently not the best current opportunity.
- Comparing commission percentages instead of dollar payouts. A 5% commission on a $600 item can pay more than a 20% commission on a $15 item.
- Treating a huge trend percentage as automatically the strongest signal. Always check the daily data behind it — a genuine ramp reads differently than a single-day spike.
- Ignoring fulfillment risk. Large, fragile, or battery-powered products can score well everywhere else and still be a poor launch choice once shipping cost and damage rates are factored in.
- Treating one week of data as permanent. Creator counts and trend direction can shift meaningfully within days on fast-moving social-commerce channels.
Expert Tips for Stronger Product Selection
- Score trend and saturation together — a rising trend with low creator competition is the strongest combination in this framework.
- Calculate revenue-per-creator, not just revenue-per-day, to spot genuine whitespace before it closes.
- Keep a running "eliminated" list alongside your "winners" list — knowing what to avoid, and why, is just as valuable as knowing what to test.
- Re-check your data weekly. Product selection is a moving target, not a one-time decision.
Current Opportunity Signals
Based on this week's Kalodata pull, the widest gaps between revenue and creator competition are showing up in home-cleaning appliances (a robot vacuum at 292 creators against $1.85M in revenue) and in an established beauty brand's new bundle launch compounding from a genuine cold start. Not available in the supplied dataset: category-wide trend data beyond this single week's pull — treat any single-week signal as a starting point for further research, not a standalone conclusion.
Future Outlook
As more sellers adopt data-driven product selection, the advantage increasingly goes to operators who can read trend direction and creator saturation together, faster than the next seller — not simply to whoever finds a trending video first. This is Operator Signal's own reasonable projection, not a confirmed industry fact.
Final Decision Guide
If you can commit to a weekly scoring habit, calculate real dollar payouts rather than comparing percentages, and are willing to eliminate a high-revenue candidate the moment its trend turns negative — this framework will meaningfully improve your product selection. If you're looking for a single tool that removes all risk or replaces supplier vetting and content testing, this isn't that; it narrows the field, it doesn't guarantee the outcome.
Action Plan Checklist
- Pull recent sales data for 10+ candidate products
- Score each candidate against all 8 signals, starting with trend direction
- Eliminate anything with a falling trend, a sub-4.0 rating, or near-zero CCR
- Rank survivors by revenue-per-creator, not just raw revenue
- Calculate the real dollar payout per sale for your top candidates
- Vet a supplier for your top pick
- Film 2–3 pieces of organic content before spending on ads
- Run a 48–72 hour organic-first test window
- Review key metrics and decide: scale, adjust, or kill
- Repeat the process weekly rather than one time
Frequently Asked Questions
What's the most important factor in choosing a TikTok Shop product?
Revenue trend direction. A product with declining recent revenue is a weaker choice than one with rising revenue, even if the declining product's total lifetime revenue is larger.
How do I know if a TikTok Shop product is oversaturated?
Compare its creator count against its revenue level. A very high creator count relative to revenue — especially alongside a flat or falling trend — signals a crowded market with little room left for a new seller.
What creator conversion ratio (CCR) should I look for?
Not available in the supplied dataset as a fixed universal benchmark — CCR varies by category. As a general reference point, a CCR meaningfully above roughly 30–40% suggests the content genuinely persuades buyers, while a CCR under 15–20% suggests most creators who post it aren't generating sales.
Is a high commission rate always better?
No. Calculate the actual dollar payout (price × commission rate) rather than comparing percentages — a low percentage on an expensive item can pay more per sale than a high percentage on a cheap one.
Should I avoid products with a falling trend even if revenue is high?
Generally yes. High lifetime revenue confirms a product has sold before; it doesn't confirm current demand. A falling trend on a high-revenue product usually means the opportunity has already passed.
What star rating is too low to sell?
A rating below roughly 4.0 usually signals a quality or fit issue that shows up later as refunds and customer-service load, regardless of how strong the other metrics look.
Can a low-revenue product be a better pick than a high-revenue one?
Yes. If the lower-revenue product has a much smaller creator count relative to its revenue — meaning far less competition for the same demand — it can represent a stronger real opportunity than a larger, more crowded product.
How often should I re-run product research?
Weekly, at minimum. Creator counts and trend direction on fast-moving social-commerce channels can shift meaningfully within days.
What fulfillment risks should factor into product choice?
Large, fragile, or battery-powered items carry higher shipping costs, higher damage risk in transit, and higher return rates — all of which can outweigh an otherwise strong revenue and trend profile.
Conclusion
Choosing the right TikTok Shop product is the single highest-leverage decision in the entire selling process — more important than ad creative, pricing tweaks, or storefront design. Revenue rank alone is the most commonly misread signal; trend direction, creator conversion, and saturation, checked together, separate a real opportunity from a product that only looks impressive on the surface. Build the scoring habit before you build the store, and treat every product choice as a small, reversible test rather than a single big bet.
Want validated product picks done for you every week? Paid subscribers to The Operator Signal get the full Top 5 winners, five eliminations, a ranked Top 10, one launch pick, ad angles, and a 3-day launch plan — built from a fresh Kalodata pull every week.


